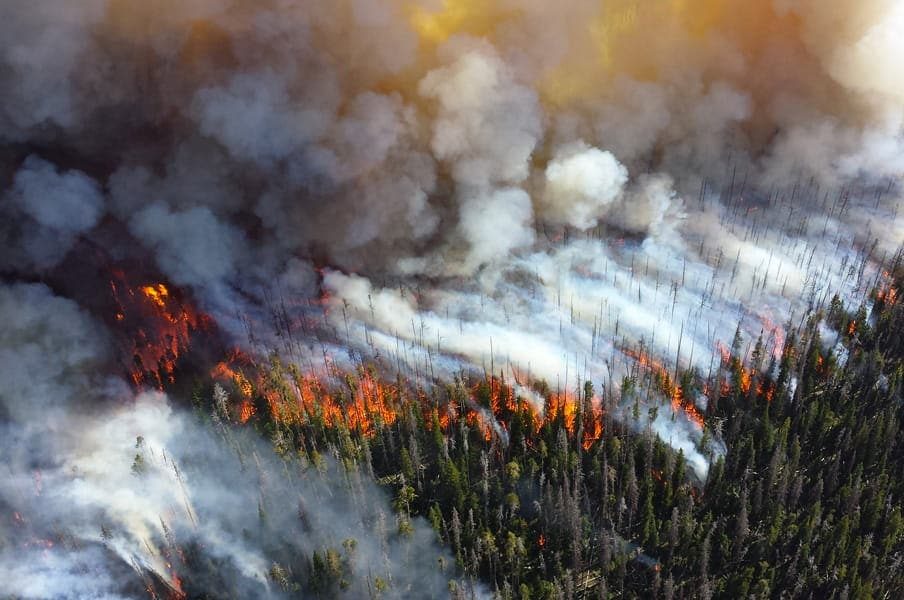
Wildfire, 2013, photograph courtesy of Mike Lewelling, National Park Service.
Your typical North American summer predictably consists of adventures to popular theme parks, coast to coast road trips, baseball games, and time with friends and family. Without fail, wildfires are included on the list of predictable American summer events. Was it even summer if you didn’t once see ash falling from the sky?
Headlines across the country, from regional and local papers, share an ominous and sinister tone, highlighting an already predicted and currently ongoing 2021 wildfire season. The west coast and adjacent states face a particularly challenging summer ahead. On the coast, California has already suffered a “daunting start,” and Washington has documented a “bad wildfire season,” already looking worse than the 2020 wildfire season. States over, Idaho is facing “potential for worst fire season in years” while Arizona wildfires “burned more acres than the next four most-burned states combined.”
Track The Wildfire Season With These Updating Maps
The aforementioned wildfires, past or present, are documented by the National Interagency Fire Center. For any wildfire resulting in more than 50 acres burned, a spot on the list is earned. Other data provided by the agency indicate not only location but an approximate geographical perimeter of the wildfire itself, approximation of burned acreage, and percentage of the wildfire contained.
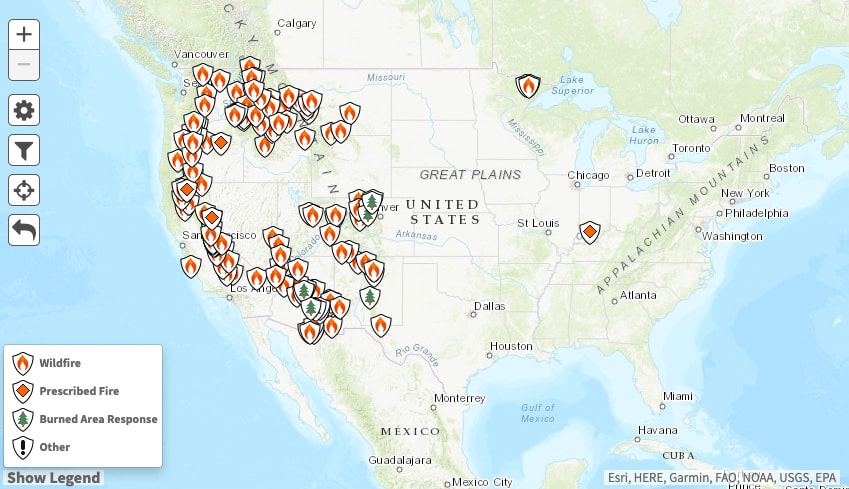
National Interagency Fire Center Updating Wildfire Interactive Map
Current data represented on the map support predictions made by the National Interagency Fire Center. In April 2021, their monthly executive summary predicted above-normal significant fire activity in specific regions of Nevada, Colorado and Utah, and increased fire potential in states including California, Oregon and Washington.
As of this month’s published prediction, the potential for fires will expand across the western US and the Great Plains, which includes Kansas, Nebraska, North and South Dakota, portions of Texas, Missouri, Montana and more.
As of July 14th, 2021, and as represented on the map, almost 918,000 acres have been burned this wildfire season due to 67 fires still burning as of today.
Summer in Smoke and Flames
The impacts of any wildfire season are felt to varying extents. For example, those with homes in affected areas are often forced to evacuate; many houses are burned and lost every year. As wildfires blaze on, physical devastation can also take many other forms.
When a wildfire occurs, the released smoke is “a complex mixture of gases and fine particles produced when wood and other organic materials burn,” the latter being the component of greatest concern to human health. When inhaled, fine particle pollution has the range to simply burn eyes or cause premature death.
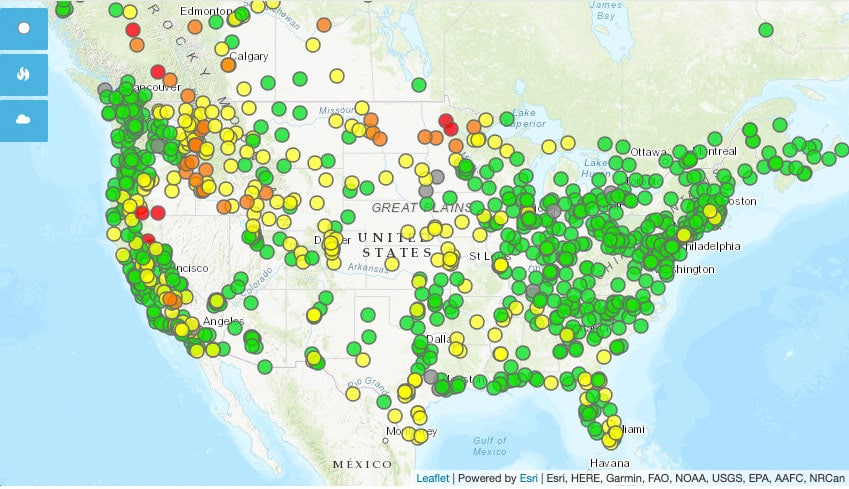
Coverage of the data provided by the National Interagency Fire Center covers approximately the same geographic area represented by AirNow’s interactive map, which the United States’ daily air quality/reporting of air pollutants.
AirNow Updating Air Quality and Fire Interactive Map
Previously mentioned wildfire-prone states, including California, Washington, Colorado, Arizona, Idaho and Canada’s British Columbia, are marked “moderate,” meaning acceptable air quality for some but risky for those sensitive to air pollution.
Within this western region, a handful of smaller areas are categorized as “unhealthy,” a point where some members of the general public begin to be at risk for physical health effects.
On one end of the spectrum, the general population’s exposure to wildfire causes shortness of breath, a cough, congestion, or decline in lung function. Sensitive populations, including people with respiratory or cardiovascular diseases, children, the elderly, outdoor workers and more, are at even greater risk when exposed to wildfire smoke. Those with disease experience exacerbated symptoms, and in general, these populations do not have sufficient health defense mechanisms or resources to protect themselves from wildfire pollutants.
AirNow’s July 2020 map shows a drastically reduced coverage of poor air quality. While this year’s map shows virtually half of the United States covered in a “moderate” warning of air quality, last year’s map shows mere portions of less than one-third of the country experiencing disruptions in air quality.
As this season’s wildfires increase in quantity and severity, a causal link to worsening shifts in air quality is undeniable.
Summer is now in full swing across the country, but the peak of wildfire season is still yet to come. Vast plains, dense forests, expansive mountain ranges and anything in between remain under constant threat once summer weather shifts, outdoor human activities, and climate events combine forces. There is rarely a summer in memory where one can’t remember a wildfire here or there. This summer, sadly, is no exception.
Like what we have to say? Sign up to subscribe to email alerts and you’ll never miss a post.
